Introduction
This study employes social network analysis to examine the Dublin Candeias Facebook group. The group comprises of some two hundred members and is one of many such groups associated with the Groupo Candieas capoeira community. The Facebook group consists of members from Dublin, as well as other groups and friends of the club located around the world. The members use Facebook for intra-group organization and sharing information about capoeira.
Process
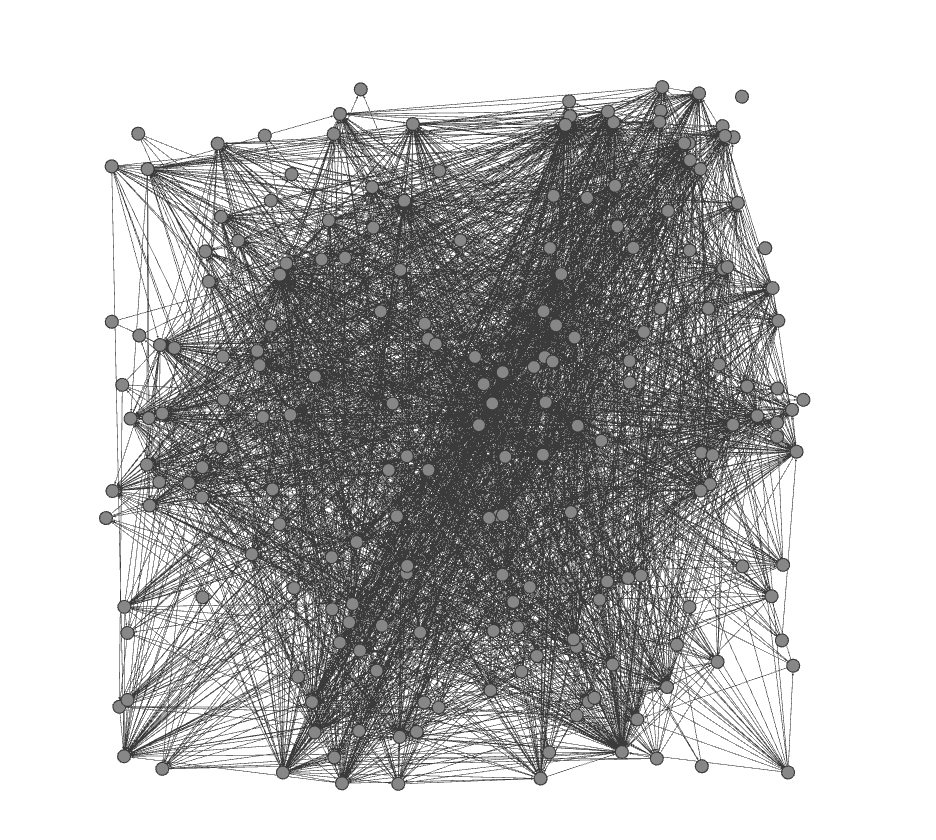
Facebook makes data collection a trivial task by exposing web based interfaces to its database. Many third party software tools exist which allow Facebook members to harvest and download this data. A powerful example of these is the Netvizz web application (http://apps.facebook.com/netvizz/). Netvizz is a Facebook app that plugs into the Facebook platform once it has been authorized to do so by the account owner. The interface presents a list of user affiliated groups and after a target group has been selected, an iterative process begins to trace the users connection to all other members of that group. The resulting file my be opened in a graph visualization package such as Gephi. Figure 1 shows this raw data as a basic graph without any processing. As can be seen, the initial graph is densely packed and contains thousands of overlapping edges. We can already infer that this community is deeply interconnected, however the graph is difficult to read or understand in any meaningful way without further analysis.
After experimenting with numerous automated layout algorithms to improve the visualization, it became evident that the dense interconnections of edges presented a problem for clearly displaying the data. Deeper research suggested that a force-directed layout algorithm should help to address this problem by “minimizing the energy of the system” (Hu, 2006). Force directed layouts attempt to produce aesthetically pleasing graphs by making the edges “of more or less equal length” (wikipedia, 2012). While this graph layout still suffers from overlapping edges, the uniform geometry of the network allows for greater balance of the vertices and improved readability.
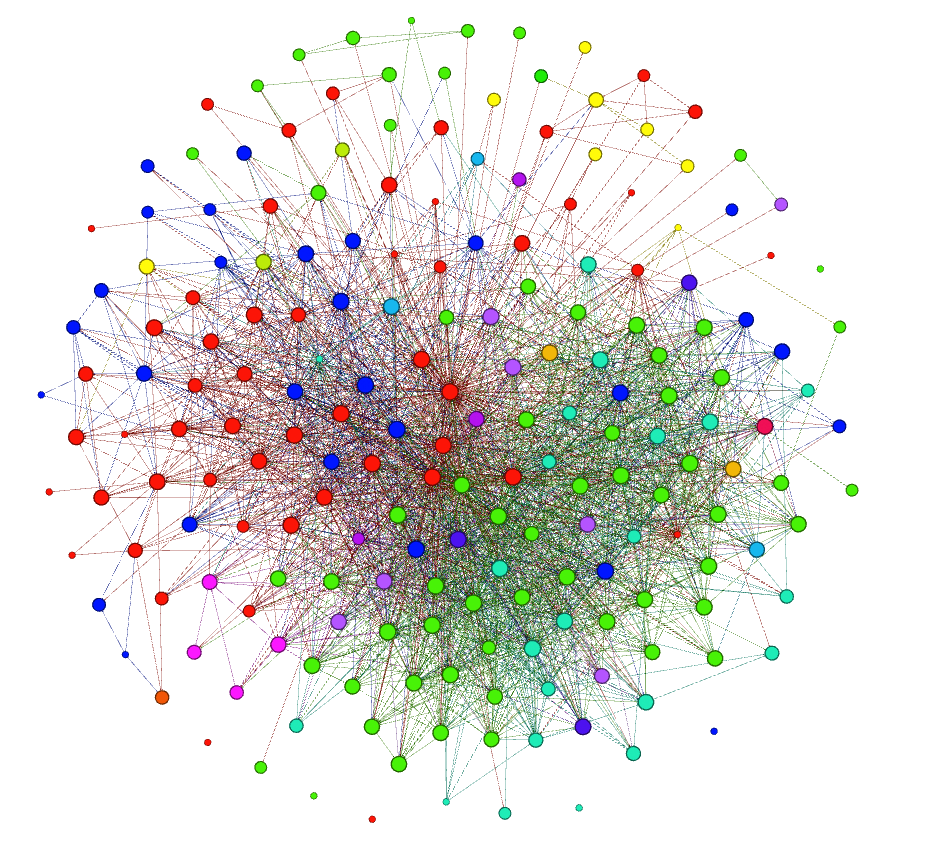
Spatialized force-directed graphs such as Yifan Hu's Multilevel, pull relevant vertices tightly together while keeping less relevant vertices at a distance. The characteristics of this dataset resulted in a Yifan Hu graph that was too dense to interpret, as well as pushing less connected vertices too far away to be noticed. Gephi also includes the Fruchterman-Reingold force-directed layout algorithm. This algorithm “models the graph drawing problem by a system of springs between neighbouring vertices of the graph, which pull the vertices together”, (Hu, 2006). By experimenting with the area and gravity parameters of this algorithm, a pleasing layout was achieved. A colour coding was applied to add some segmentation for language (Figure 2) by selecting the locale attribute as a partition parameter; (red and blue for UK and US English, light green for Portuguese, etc.). Finally, a weighting was applied to the sizes of the individual vertices based on their degree index (i.e. combined in and out degree) in order to identify the most highly connected members of the group. Gephi makes this operation trivial by calculating the combined degree value, after which it is simply a matter of selecting this as a ranking parameter.
Results and Interpretation
The results of the analysis were extremely revealing, with more information uncovered after each treatment. The initial raw data exported via Netvizz, revealed that a high concentration of interconnected links exist between group members. This suggested an echo chamber effect might be taking place, i.e. close connections between almost all members within the group (Adamic, 2012). When mapped onto a graph the result is a dense weave of overlapping edges due to limited available space. Best practice for aesthetically pleasing graph design recommends against overlap, since this can obscure connections or imply connections where none exist, i.e. where an edge passes too close to an unrelated vertex, thus obscuring “the sense and substance of the data”, (Tufte, 1983). This is a unfortunate artefact resulting from the chosen data set, but while it does obscure much information, the Gephi software package allows for closer inspection or any edge or vertex to help clarify a given relationship. The artefact is also revealing in that it clearly shows how closely connected the group actually is, with each member sharing connections with many others.
Figure 1. Raw Netvizz data in Gephi.
Examining the languages used by members (as specified in their Facebook settings) reveals that there are two major languages in use, i.e. Brazilian Portuguese and English (US and British). Two smaller groups also exist, i.e. Spanish variants and Polish, as well as a significant variety of other languages. Given that the majority of group members live in Ireland and are either Irish or Brazilian, this is not an unexpected result. However the mixture of other languages indicates a cross pollination effect between this and other Candeias groups; a result which is at odds with the expectation of finding an echo chamber effect.
Figure 2. Fruchterman-Reingold, colour coded by language
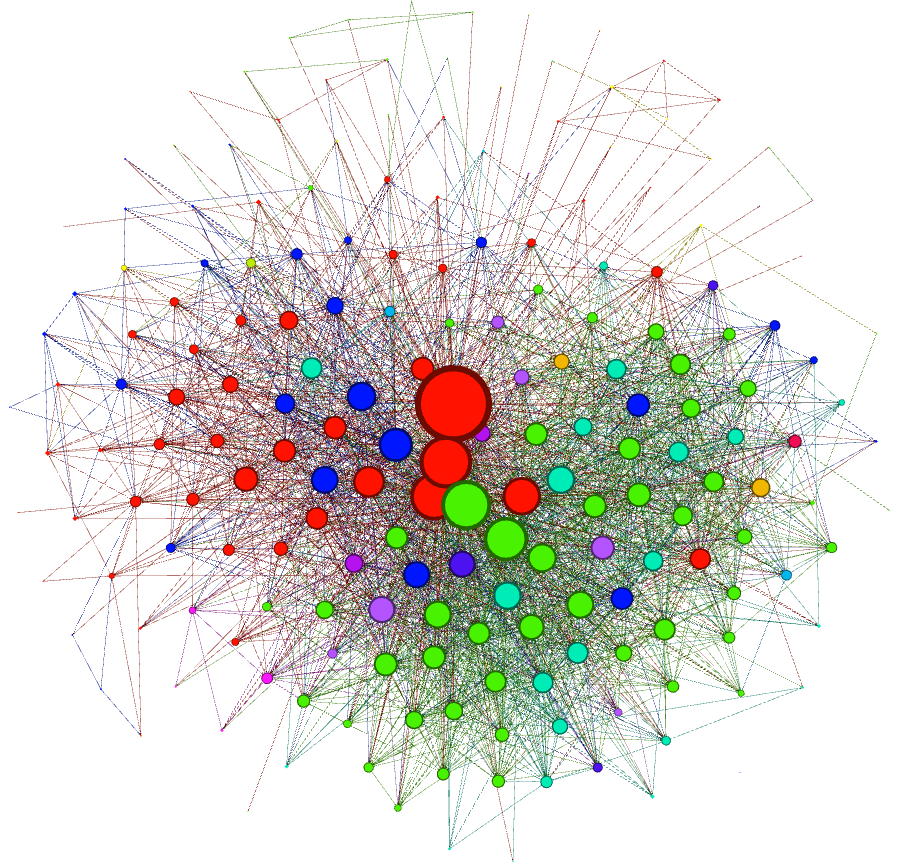
Weighting the size of each vertex by its degree within the network (Figure 3) was perhaps the most revealing portion of the analysis. Given that this is a Dublin group, one might expect members located in Dublin to have more connections. In actuality, trainers and masters have more connections, regardless of their geographic location or level of participation in the Dublin training sessions. Examining both the in and out degrees for connectedness revealed the most connected members as having a significantly higher out-degree than in-degree (Table 1). This indicates that a network prestige effect is driving the formation of connections. A “rich get richer” effect (Adamic, 2012), where new members begin by requesting friendship from the trainers, i.e. who they already know, and whom already have many existing connections. After the trainers, we generally see a flip in the ratio of in-to-out-degree for regular members.
Table 1. Top ten connected nodes.
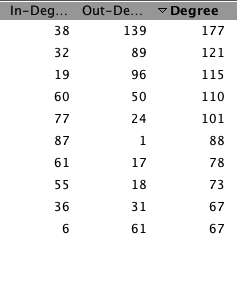
Figure 3. Weighted by degree of connectedness
Conclusion
This study reveals the structure of the group and highlights the nature of relationships between members. Most members are highly connected, (although less connected members do exist, with six individuals having no connections at all). However, “while clustering tendencies in link networks ... may appear to paint a convincing picture of affiliations and associations” (Brunes and Burgess, 2012), supporting qualitative data could verify this and help inform any reliable interpretation. It may simply be the case that most connections are created though mechanisms such as Facebook recommendations, however such speculation is outside the scope of the current study. Further research would be required to determine the motivations for connections and enhanced data such as frequency of communication, combined with automated community algorithms, would also allow for deeper insights into the group composition and organization.
References
Adamic, Lada. 2012. Social network Analysis. Coursera. Retrieved Online 17.11.2012. https://class.coursera.org/sna-2012-001
Bruns, Axel & Burgess, Jean. 2012. Chapter 28, Doing Blog Research. Research Methods & methodologies in Education. Sage. London.
Hu, Yifan. 2006. Efficient and High Quality Force-Directed Graph Drawing. The Mathematica Journal. Wolfram Research Inc. Illinois.
Tufte, Edward R. 1983. The visual display of quantitive information. Graphical Press. Connecticut.
Wikipedia, Force-based algorithms (graph drawing). Retrieved Online, 17.11.2012. https://en.wikipedia.org/wiki/Force-based_algorithms_(graph_drawing)